
Securing your crop
Check your pheromone traps without walking the farm.
A lightweight aluminium pheromone trap with the camera built in. You hang it; it photographs its own sticky tray and sends the picture straight to your dashboard.
Designed, built and supported in South Africa by Silico

How it works
Three steps, and no one drives out to look.
It photographs the tray
The trap wakes on schedule and captures its sticky tray, setting its own exposure.
It uploads over the cell network
A 4G LTE modem sends the image encrypted, straight from the orchard to your dashboard.
You review it in the browser
The image lands in your trap's gallery. Nothing to install, nothing to sync.

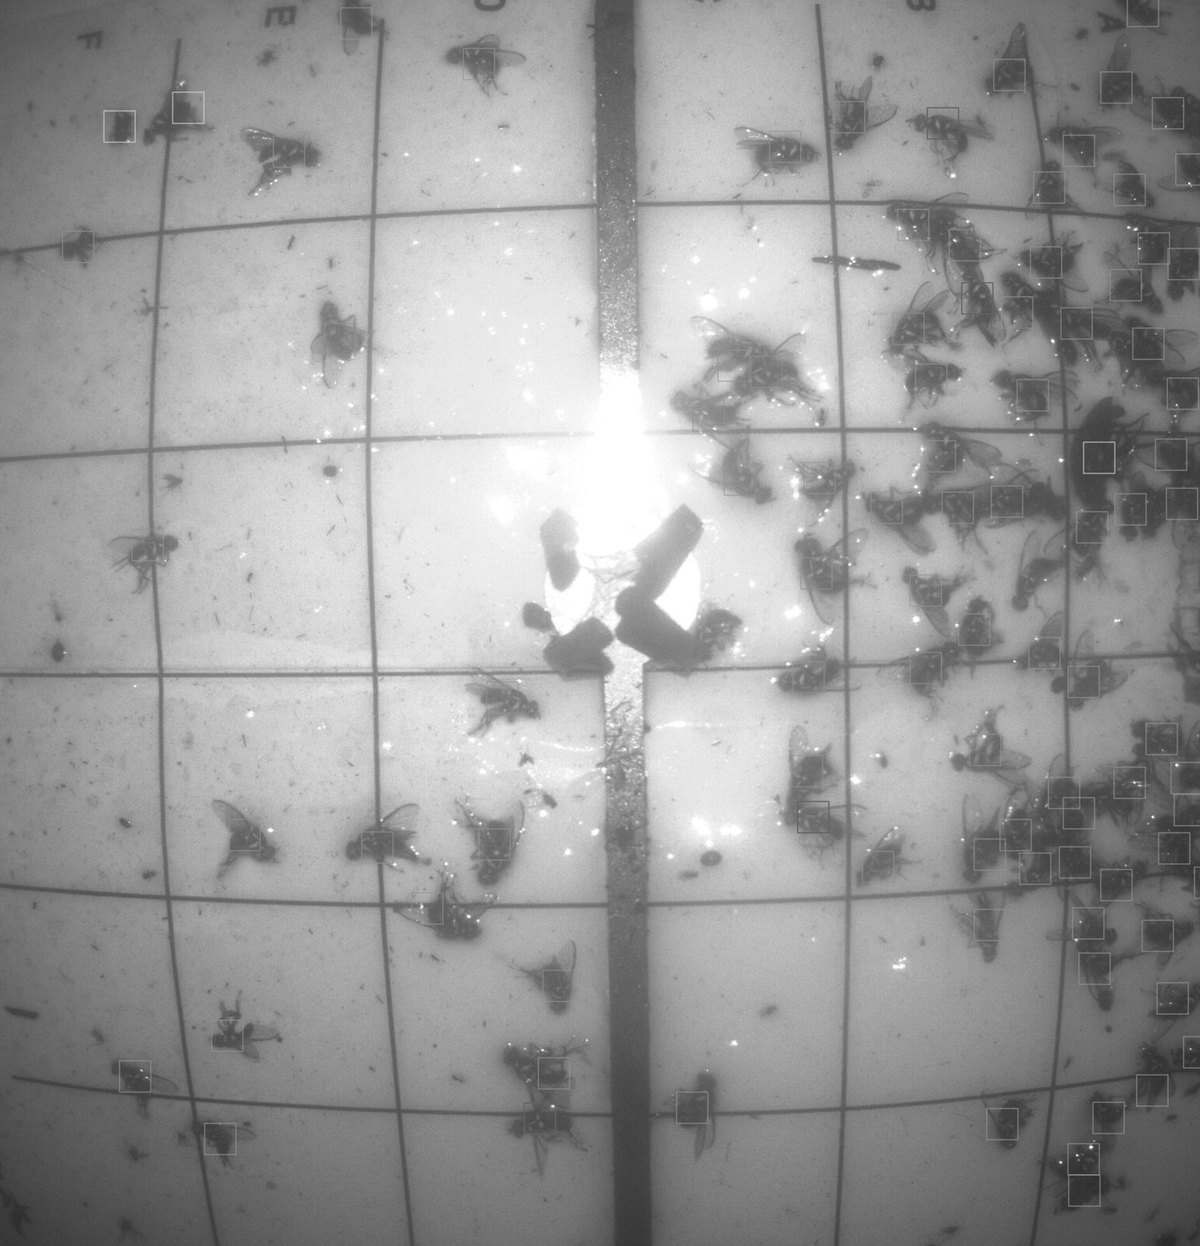
One trap, two weeks, played back in order.
The liner fills day after day. One photograph tells you what is on the tray today. The run of them tells you which way the pressure is moving — and that is the part worth acting on.
Real daily captures from trap 210007, 26 July to 9 August, with the catches exactly as they were marked in the dashboard. Bright rings are that day's new catches.

The trap
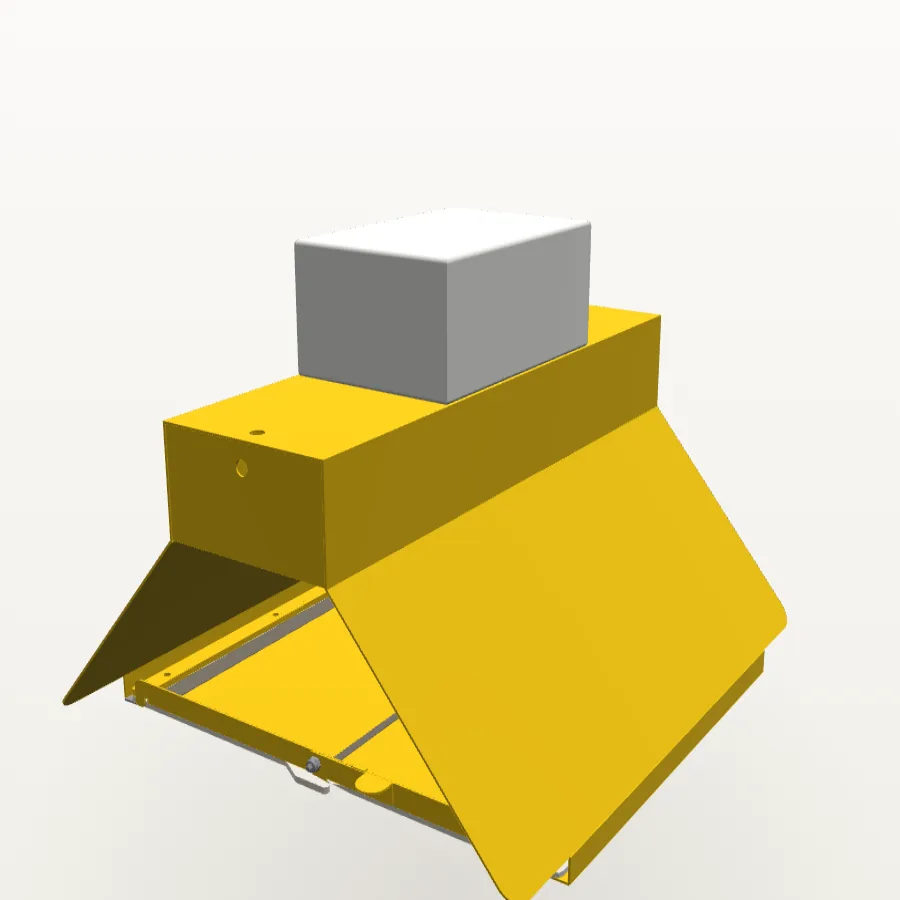
Folded aluminium, built to hang outside for years.
There is nothing to assemble in the field. Hang it or bolt it to a pole, slide in a liner, fit a lure, press the button — and it photographs the tray the next morning.
- Aluminium body
- Light enough to hang in a tree, and it will not rust. The UV-resistant powder coat keeps the yellow from fading, so it stays easy to find between the rows.
- Two ways to mount
- Pre-drilled holes for hanging, or bolt it to a pole using the 3 mm mounting flanges cut into the base plate.
- One-button installation
- Once it is up, one press of the button and it is installed. Nothing to configure in the field.
- Camera housing
- Camera, 4G LTE modem, GPS and battery sit in the housing on top, looking straight down at the liner.
- Gridded sticky tray
- Slides in on rails from the front. The printed grid keeps counts comparable from one liner to the next.
- Lure holder
- In the middle of the tray, in the centre of every photograph, so the lure never blocks the view.
What you see
Every photograph arrives with its own record.
You are not just getting a picture. Each capture comes with the state of the trap that took it, so a quiet trap is obvious early.
- Time of capture
- So a run of captures reads as a timeline you can compare week to week.
- Battery level
- So a trap gets topped up on a planned visit instead of going dark mid-season.
- Temperature at the trap
- Conditions where it actually hangs — context for catch rates and lure life.
- Position
- From its own GPS, so a trap that has been moved is easy to spot.
Four captures, four mornings running — the trap is reporting as it should.
Illustration of the trap list. Serial numbers and readings shown are examples.
Getting the numbers out
Counts you can chart, week by week.
Every catch you mark on a photograph becomes a number against that trap and that day. From there the dashboard does the arithmetic.
- New catches per day, per trap. A bar for every morning, so a flight shows up the day it starts, not at the next scouting round.
- Weekly totals side by side. The week numbers your spray programme already runs on, one row per trap.
- Every number has its photograph. Counts stay attached to the image they were marked on, so any figure can be checked against the picture.
| Trap | Wk 29 | Wk 30 | Wk 31 | Wk 32 |
|---|---|---|---|---|
| 210007 | 34 | 38 | 69 | 17 |
| 210013 | 27 | 27 | 57 | 43 |
| 210001 | 1 | 3 | 1 | 5 |
| 210014 | – | – | 3 | 1 |
Real counts as marked in the dashboard: trap 210007's fortnight above, and weekly totals for four traps over the same weeks.
On the dashboard roadmap
Every trap on a map of your farm.
The next step for the dashboard: your traps on a satellite view of the farm, each one coloured by what it caught. Green is quiet, amber is watch, red is act — and you drive to the red one.
- Colour by catch. Each trap shows its new catches and turns amber or red against thresholds you set for the block.
- Tap a trap. Block, three-day sum, today's count and battery, without leaving the map.
- Plan the drive. See which blocks are hot before anyone leaves the shed.

The map view with one trap selected: new catches per trap, and the three-day sum for the one you tap.
Want traps of your own?
Tell us what you grow and how your blocks are laid out, and we will work out what a deployment looks like.
Already have traps? The dashboard runs in any browser, nothing to install. Growers see their own traps and images and nothing else; your team sees everything.